One of my favorite administrative views in DB2 LUW is SYSIBMADM.SNAPDB. It provides basic stats at the database level - including my very favorite ROWS_READ. When the users claim that the database is running slow and the queries are taking longer, I always take a quick look at the rows read to see if I spot anything out of ordinary. But the question "out of ordinary" cannot be answered by querying this administrative view.
In order to answer the "out of ordinary" question, we have to do more work. We need to first collected this information on a regular basis (say once an hour) and store it in a table so that we can query it.
The Raw Data
Now assume we have done that, we can issue a simple SELECT statement against our table and get accumulative representation of ROWS_READ. For illustration purposes, I have made up these numbers.

Simple graph based on the raw data
Once we have the raw data, we can create a graph from it - because we all know a picture says a 1000 words.

Not bad. We see a jump. However, is this user friendly, specially if the database has been up for days and the accumulative value of ROWS_READ is so high. Perhaps we would not be able to spot that jump.
The better way
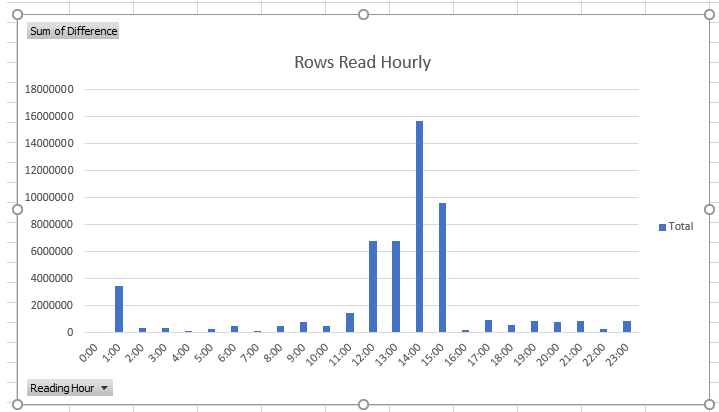
The better presentation of this data is by showing the incremental rows read from one hour to the next, something like this:

With this type of presentation, everyone can easily see that there was some abnormal activity between 12:00 to 15:00 and the worse was at 14:00. And if the database was up for days, the graph would still look the same.
How can we do this?
Converting a series of accumulative numbers into a series of differential numbers is not that easy via SQL. It does require advanced SQL skills and the use of Table Functions. Luckily, this type of conversions is already embedded in the db2pro system and ready to be exploited.
Need to learn more?
If you like to learn more, please do not hesitate to drop us a line and we will be more than happy to assist you.


